deff(x): '''The function we want to minimize''' return (x-3)**2 deff_grad(x): '''gradient of function f''' return (x-3)*2 x = 6 y = f(x) MAX_ITER = 300 curve = [y] i = 0 step = 0.1 previous_step_size = 1.0 precision = 1e-4
#下面展示的是我之前用的方法,看上去貌似还挺合理的,但是很慢 while previous_step_size > precision and i < MAX_ITER: prev_x = x gradient = f_grad(x) x = x - gradient * step new_y = f(x) if new_y > y: #如果出现divergence的迹象,就减小step size step *= 0.8 curve.append(new_y) previous_step_size = abs(x - prev_x) i += 1 print("The local minimum occurs at", x) print("The number of iterations is", i)
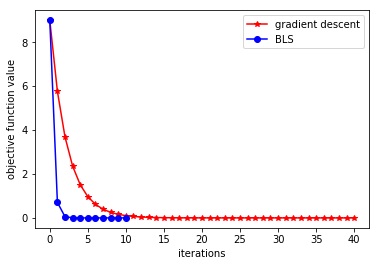
plt.figure() plt.show() plt.plot(curve, 'r*-')
plt.xlabel('iterations') plt.ylabel('objective function value') #下面展示的是backtracking line search,速度很快 x = 6 y = f(x) alpha = 0.25 beta = 0.8 curve2 = [y] i = 0 previous_step_size = 1.0 precision = 1e-4 while previous_step_size > precision and i < MAX_ITER: prev_x = x gradient = f_grad(x) step = 1.0 while f(x - step * gradient) > f(x) - alpha * step * gradient**2: step *= beta x = x - step * gradient new_y = f(x) curve2.append(new_y) previous_step_size = abs(x - prev_x) i += 1 print("The local minimum occurs at", x) print("The number of iterations is", i)
The local minimum occurs at 3.0003987683987354
The number of iterations is 40
<Figure size 432x288 with 0 Axes>
The local minimum occurs at 3.000008885903001
The number of iterations is 10