用gprof做性能分析
文章来自微信公众号“科文路”,欢迎关注、互动。转发须注明出处。
gprof (GNU profiler) 是 GNU Binutils 的一员,可以方便的找出程序中各个部分的调用关系和次数。配合其他工具,可以更方便的以图形化展示性能分析结果。
工作流
- 编译时添加
-pg参数 - 运行程序
- 使用
gprof处理运行程序后产生的gmon.out文件 - 分析
一个例子
1 | // example.c |
编译、运行
1 | g++ -o example -pg example.cpp |
文本化分析
gprof ./example gmon.out | less -S- 生成 log 文件分析,
gprof example gmon.out | tee log.log
1 | Flat profile: |
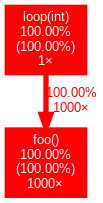
生成 gprof 图
- 安装工具:Graphviz,gprof2dot (Python3)
gprof ./example gmon.out | gprof2dot | dot -Tpng -o example.png
其他工具对比总结
如果碰到一个不太熟悉和了解的系统,我们可以先用 perf(没有源代码的情况)、gprof (有源代码的情况)快速定位热点函数和模块,然后针对热点模块用 stap 进行测量相关函数的具体时间分布。
都看到这儿了,不如关注每日推送的“科文路”、互动起来~